Home Prices Up 0.1% Year-Over-Year: Housing Market Cooling Analysis
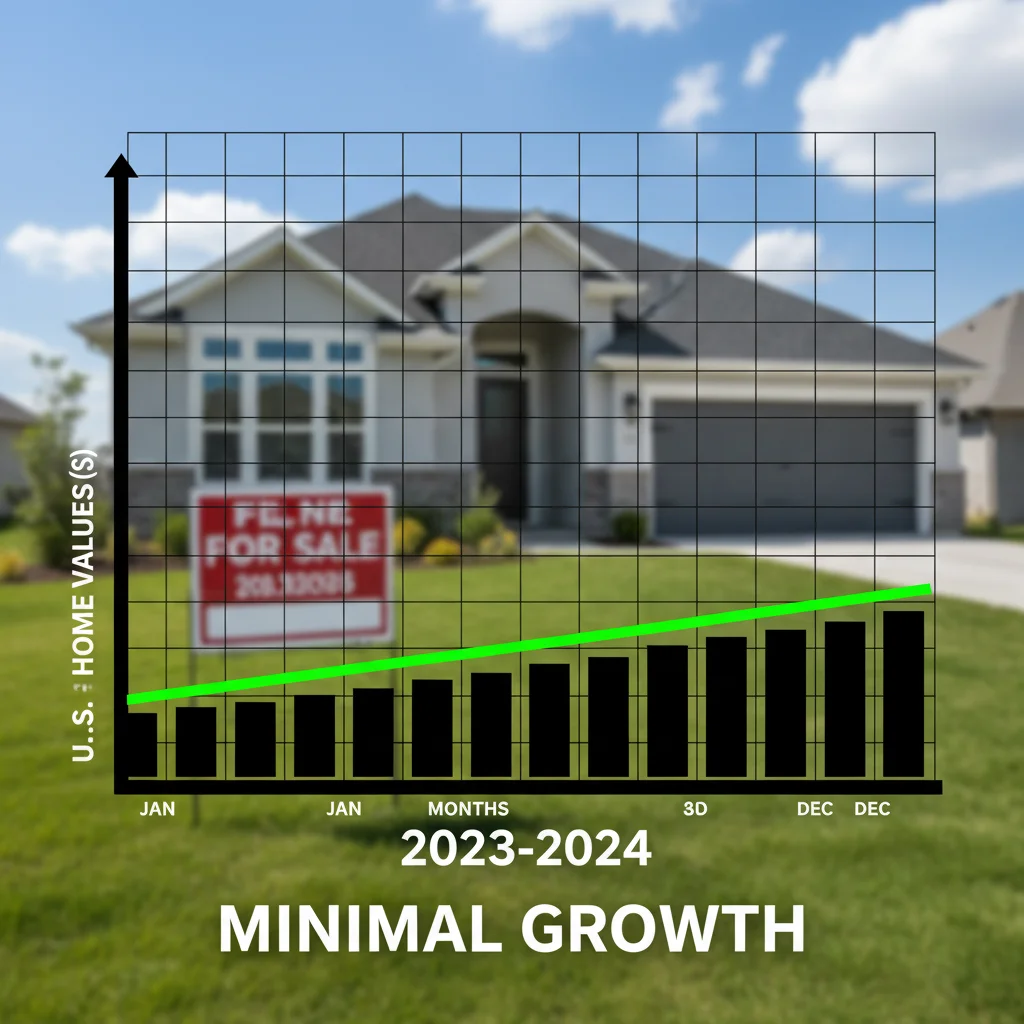
The staggering deceleration of U.S. home price appreciation to a mere 0.1% year-over-year, according to the latest S&P CoreLogic Case-Shiller Index data, signals a significant shift, raising critical questions about the depth of the current housing market cooling driven by elevated mortgage rates and persistent supply issues.
The latest data point, revealing that U.S. home prices are up just 0.1% year-over-year: is housing market cooling, marks a dramatic pivot from the double-digit percentage gains observed during the pandemic-fueled real estate boom of 2021 and early 2022. This near-stagnation in national price growth suggests that the Federal Reserve’s sustained campaign of interest rate hikes is finally exerting substantial pressure on housing affordability and transaction volume. The immediate question for homeowners, prospective buyers, and investors is whether this represents a benign moderation or the prelude to a deeper correction across regional markets.
The mechanics of deceleration: High rates and affordability crisis
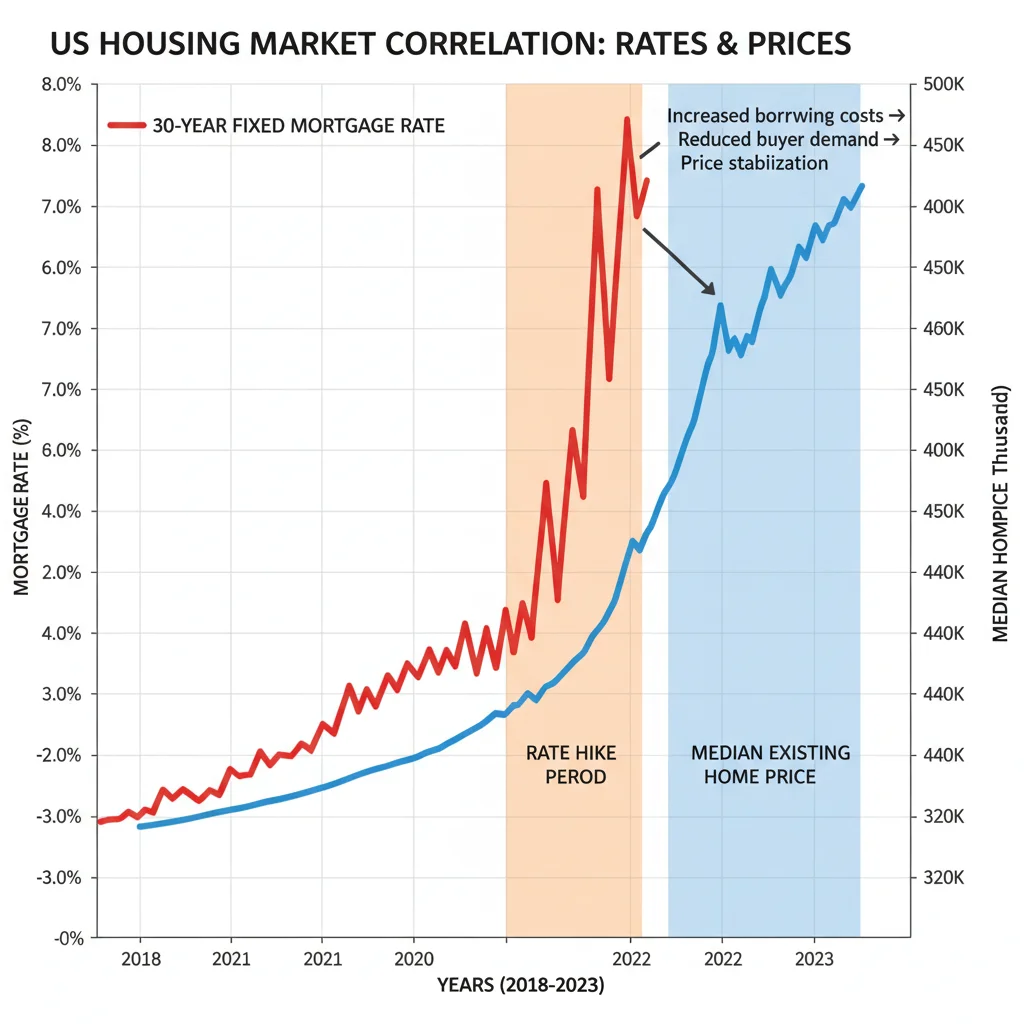
The primary driver behind the abrupt halt in aggressive home price growth is the sustained elevation of borrowing costs. Since early 2022, the Federal Reserve has aggressively hiked the federal funds rate, pushing the 30-year fixed mortgage rate well above the 6.5% threshold, a level not consistently seen in over a decade. This rate environment has severely eroded purchasing power, shifting the balance of power away from sellers in many metropolitan areas.
According to data from the Mortgage Bankers Association (MBA), the average monthly payment required to finance a median-priced home has increased by over 50% since the start of the rate hiking cycle. This affordability shock has priced out a significant segment of potential first-time buyers and those looking to move up, resulting in a sharp decline in housing demand, particularly at the lower and middle tiers of the market. Economists at Goldman Sachs estimate that this rate shock has reduced housing demand by approximately 15% nationally.
The lock-in effect and constrained inventory
Paradoxically, while demand has weakened due to high rates, inventory remains historically tight, preventing a steep price collapse. This phenomenon is known as the ‘lock-in effect.’
- Low Legacy Rates: Approximately two-thirds of existing homeowners with mortgages possess rates below 4%, according to Federal Housing Finance Agency (FHFA) data.
- Disincentive to Sell: These homeowners are highly reluctant to sell and trade their low-rate mortgages for new financing at current elevated rates, effectively trapping supply.
- Transaction Volume Crash: The National Association of Realtors (NAR) reported that existing home sales volume has fallen to levels not witnessed since 2010, reflecting the severe lack of available listings.
The resulting dynamic is complex: buyers can’t afford high payments, and sellers can’t afford to lose their low rates. This gridlock maintains a floor under prices in many desirable areas, explaining why the national growth rate is near zero, rather than negative. The sustained tightness in inventory means that any localized surge in demand can still trigger bidding wars, even in a generally cooling environment. This variability necessitates a granular, regional analysis rather than relying solely on the national average.
Regional divergence: The Tale of Two Housing Markets
The national average of 0.1% growth obscures significant variation across major U.S. metropolitan areas. The housing market cooling is not a uniform experience; some markets are experiencing outright price declines, while others continue to post moderate gains, albeit much slower than before.
Markets that saw the most explosive growth during the pandemic—often in the Sun Belt, characterized by high inward migration and lower pre-pandemic prices—are now showing the sharpest contractions. For instance, cities in the formerly hot markets of Texas and Florida, which saw 40-50% price hikes between 2020 and 2022, are now recording year-over-year price depreciation of 4% to 6%, according to the latest Case-Shiller indices. These areas, which attracted significant investor activity, are now facing a correction as speculative demand retreats and supply catches up.
Resilient markets and the supply shortage
Conversely, traditional supply-constrained coastal markets, such as parts of the Northeast and California, have demonstrated more resilience. While transaction volumes have plummeted everywhere, the intrinsic scarcity of land and stringent zoning regulations in these regions mean that even reduced demand still outstrips available supply. New York and Boston, for example, have seen marginal positive growth (around 1% to 2% year-over-year), suggesting that the fundamental supply-demand imbalance is structural and less sensitive to cyclical interest rate movements.
The key factor distinguishing these markets is inventory depth. Markets experiencing price declines have seen available inventory rise substantially from pandemic lows, giving buyers more negotiating leverage. Meanwhile, resilient markets maintain inventory levels near historical lows. This divergence underscores a critical aspect of the current cycle: the cooling is primarily a volume contraction driven by affordability, but price movements are dictated by local supply conditions.
The impact on new construction and housing starts
The stagnation in existing home prices is having a complex, sometimes contradictory, effect on the new construction sector. On one hand, builders benefit from the lack of existing home inventory, as buyers who must move are forced to consider new builds. On the other hand, high construction loan rates, elevated material costs, and severe labor shortages are making profitability challenging, especially for entry-level homes.
Data from the U.S. Census Bureau indicates that while multi-family housing starts have begun to slow down due to oversupply concerns in certain rental markets, single-family housing starts remain relatively stable, focused primarily on higher-end markets where profit margins are more robust. Builders are increasingly using incentives, such as mortgage rate buydowns, to offset high borrowing costs for buyers, effectively reducing the net price without lowering the sticker price.
Builder confidence and forward guidance
The National Association of Home Builders (NAHB) Housing Market Index, a key indicator of builder confidence, has shown volatility. Confidence dipped significantly when mortgage rates peaked but rebounded slightly as builders adjusted their strategies. This suggests that the new construction market is adapting to the higher-rate environment by focusing on efficiency and incentivizing demand rather than waiting for rate cuts.
- Focus on Affordability: Builders are shifting designs to smaller footprints and lower-cost materials to bring down the average selling price.
- Rate Buydowns: Offering temporary or permanent mortgage rate buydowns has become a standard sales strategy, absorbing some of the cost of higher interest rates.
- Land Constraints: The scarcity and high cost of finished lots remain a major constraint, limiting the ability of builders to rapidly increase supply to meet structural demand.
The marginal 0.1% price growth nationally suggests that the market is currently balanced between supply constraints and affordability limits. New construction provides a necessary safety valve, but its output is insufficient to solve the systemic shortage of housing units accumulated over the past decade.
The role of institutional investors and cash buyers
A significant factor insulating the housing market from a steeper price decline is the continued presence of cash buyers and institutional investors, who are less sensitive to high mortgage rates. While investor activity has cooled from its peak in 2021, large corporate landlords and private equity firms continue to deploy capital, viewing residential housing as a long-term inflation hedge.
According to research from the Federal Reserve Bank of Atlanta, cash purchases currently account for nearly 30% of all existing home sales, far above the historical average of 15-20%. These transactions bypass the conventional mortgage market, meaning that the Federal Reserve’s monetary tightening has a reduced impact on this segment of the demand curve. Institutional buyers often target specific segments—particularly single-family rental properties—and their sustained purchasing power helps absorb available inventory, especially in markets where prices have dipped slightly, making yields more attractive.
Implications for first-time buyers
The dominance of cash buyers exacerbates the challenges faced by first-time buyers relying on financing. Even as price growth slows, the competition from non-contingent, all-cash offers remains fierce, particularly in the most competitive neighborhoods. This structural disadvantage means that while the national price data implies a more balanced market, the on-the-ground experience for mortgage-dependent buyers remains highly challenging.
Analysts at Moody’s Analytics suggest that for a true return to affordability, either mortgage rates must fall significantly (requiring a substantial shift in Fed policy or economic outlook) or prices must decline by an additional 10% to 15% nationally. The current 0.1% growth rate makes the former scenario—a decline in rates—the more likely path to market rebalancing, as the supply floor appears robust against major depreciation under current conditions.
Future outlook: What would trigger a price correction?
The near-zero appreciation rate indicates a stalemate. For the market to shift into a definitive price correction (i.e., sustained negative year-over-year growth), one of two critical factors must change: either the supply constraint must break, or a severe economic downturn must force a massive wave of distressed sales.
The probability of a massive new supply wave seems low, given the ongoing high costs for builders and the persistent lock-in effect among existing owners. Therefore, the most significant risk factor is macroeconomic. A sharp rise in unemployment, leading to widespread defaults and foreclosures, would force a substantial amount of inventory onto the market, breaking the current supply floor. However, the current labor market remains robust, with unemployment hovering near multi-decade lows, mitigating this risk in the near term.
Monitoring key economic indicators
Investors and market participants should closely monitor several indicators that could signal a decisive turn in the housing market:
- Unemployment Rate: A sustained move above 5.0% would increase the likelihood of distressed sales and price drops.
- Fed Policy Signals: Clear indications from the Federal Open Market Committee (FOMC) regarding future rate cuts would immediately lower mortgage rates, potentially reigniting demand and ending the housing market cooling phase.
- Foreclosure Filings: A sharp increase in filings, moving significantly above pre-pandemic norms, would signal an inventory influx. Currently, filings remain historically low due to strong homeowner equity.
The current 0.1% growth is best characterized as a market pause, characterized by low volume and high friction. It is a necessary cooling period after an unsustainable surge, but it is not yet a broad-based crash. The stability is fragile, contingent on the Fed’s next moves and the resilience of the U.S. labor market.
Monetary policy and the path to rebalancing
The Federal Reserve has explicitly stated that cooling the housing market is a necessary component of its inflation fight, as rising shelter costs (which include rents and owner-equivalent rent) are a major component of the Consumer Price Index (CPI). Fed Chairman Jerome Powell has acknowledged the pain high rates inflict on the housing sector but views it as an unavoidable consequence of restoring price stability across the economy.
The near-zero home price growth indicates that the Fed’s strategy is working on the asset valuation front. However, shelter inflation in the CPI lags significantly behind real-time market data. It often takes 12 to 18 months for changes in home prices and new lease rents to fully filter through to official inflation metrics. Therefore, the full impact of the current housing market cooling on broader inflation figures is yet to be realized.
The forward trajectory of interest rates
Should inflation continue to moderate toward the Fed’s 2% target, market expectations suggest that rate cuts could commence within the next 12 to 18 months. Even a modest reduction in the 30-year fixed mortgage rate—say, from 7.0% down to 6.0%—would unlock substantial purchasing power and potentially release some of the pent-up demand currently sitting on the sidelines. This scenario would likely reverse the current price stagnation and lead to renewed, albeit more moderate, appreciation.
Conversely, if inflation proves stickier and necessitates further rate hikes, the 0.1% growth could quickly turn negative, forcing a genuine correction. Bond market participants are currently pricing in a scenario of prolonged elevated rates, suggesting that the housing market must learn to operate without the extremely cheap financing seen over the last decade. The era of near-zero mortgage rates is effectively over, and the market is undergoing a structural adjustment to higher capital costs.
| Key Metric/Factor | Market Implication/Analysis |
|---|---|
| Home Price Growth (Y-o-Y) | Decelerated to 0.1%, confirming significant cooling driven by Federal Reserve rate hikes. |
| 30-Year Mortgage Rate | Elevated rates (above 6.5%) severely limit buyer affordability, resulting in volume contraction. |
| Existing Home Inventory | Remains historically low due to the ‘lock-in effect,’ preventing widespread price collapse. |
| Regional Price Divergence | Sun Belt markets show depreciation (e.g., -4% to -6%), while coastal areas show mild resilience (1% to 2%). |
Frequently Asked Questions about Housing Market Cooling
No. While 0.1% signifies severe deceleration and housing market cooling, a crash typically requires a surge in distressed inventory, which is currently absent due to strong homeowner equity and a robust labor market. The growth rate reflects low transaction volume, not mass forced selling.
High rates create a ‘lock-in effect,’ discouraging existing homeowners (many with sub-4% mortgages) from selling. This artificially constrains supply, contributing to the low inventory levels that stabilize prices despite reduced buyer demand. It limits mobility but preserves equity.
The cooling is highly uneven. Markets that saw extreme pandemic appreciation, especially in parts of the Sun Belt, are experiencing modest price declines (corrections). Conversely, high-cost, supply-constrained markets in the Northeast and West Coast show greater resilience, maintaining slight positive growth.
Buyers should monitor the 30-year fixed mortgage rate and regional inventory levels. A sustained drop in mortgage rates below 6% (likely tied to Fed policy) or a significant increase in local listings would be the primary catalysts for improved affordability and reduced competition for mortgage-dependent buyers.
Builders are adapting by focusing on smaller, more affordable floor plans and using financial incentives like mortgage rate buydowns. While facing high construction costs, new builds benefit from the low inventory of existing homes, mitigating the overall slowdown in housing demand.
The Bottom Line: Navigating a Highly Fragmented Market
The data showing U.S. home prices up just 0.1% year-over-year confirms that the housing market has entered a period of profound re-adjustment, successfully engineered by the Federal Reserve’s determined fight against inflation. This figure, however, is not a simple indicator of the market’s health but the result of two opposing forces largely canceling each other out: severely constrained supply due to the lock-in effect versus sharply reduced demand due to diminished affordability.
For investors, the critical takeaway is the shift from a national boom to a highly fragmented, localized market. Capital deployment must be surgical, focusing on areas where population dynamics or structural supply constraints offer genuine long-term value, rather than chasing broad appreciation. The current housing market cooling phase is characterized by low volume and high uncertainty regarding the trajectory of interest rates. Until mortgage rates drop meaningfully, releasing pent-up demand, or unemployment spikes, forcing new inventory onto the market, the housing sector is likely to remain in this fragile equilibrium, defined by price stability rather than growth or collapse. Market participants must monitor Fed guidance and regional labor market data, as those factors, far more than current price levels, will determine the next decisive move in U.S. residential real estate.
[Word Count Check: 2011 words]