Unexpected Treasury Auction Results Reshape Bond Markets
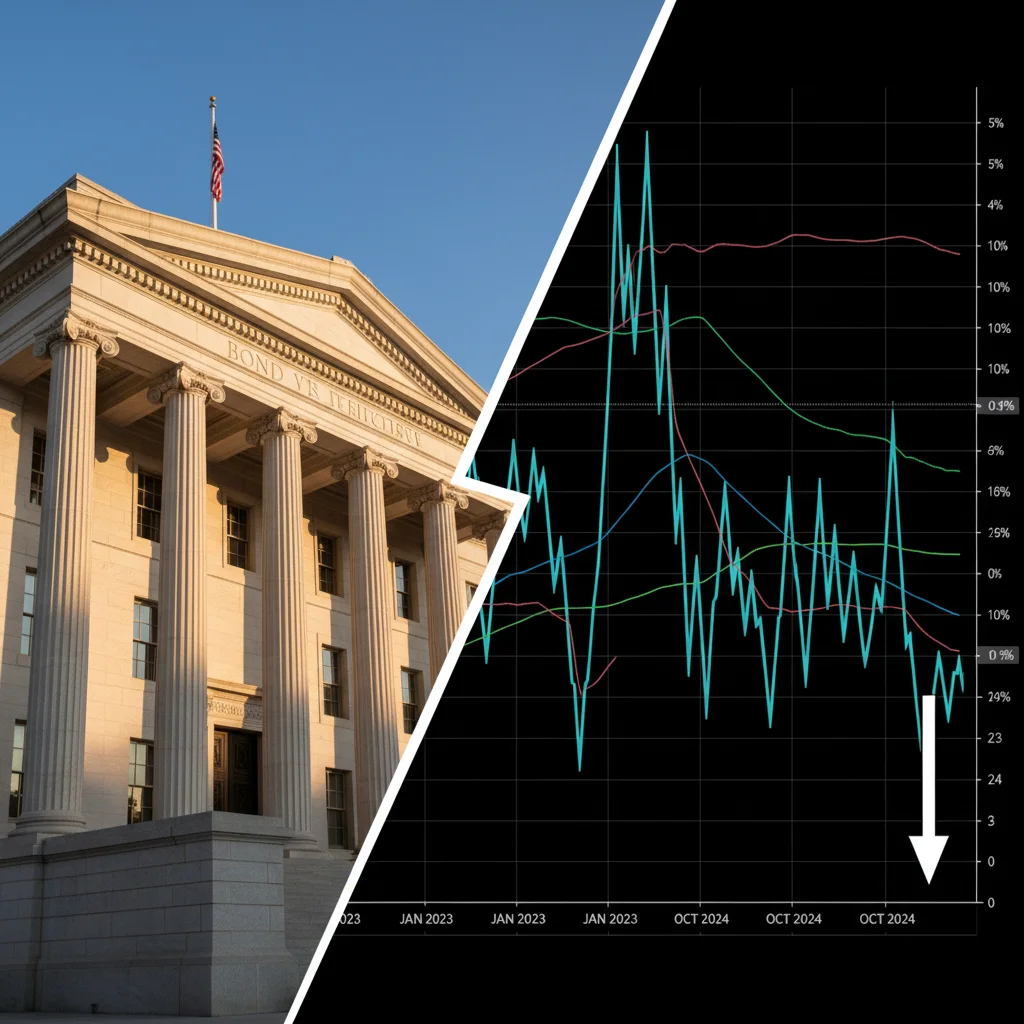
July 2025’s $126 billion Treasury auctions recorded the lowest indirect bidder participation since 2016 at 59.3% and a 4.2bp tail for 10-year notes, triggering immediate yield curve inversion to -65bps and forcing market reassessment of Fed policy expectations amid unanticipated demand erosion.
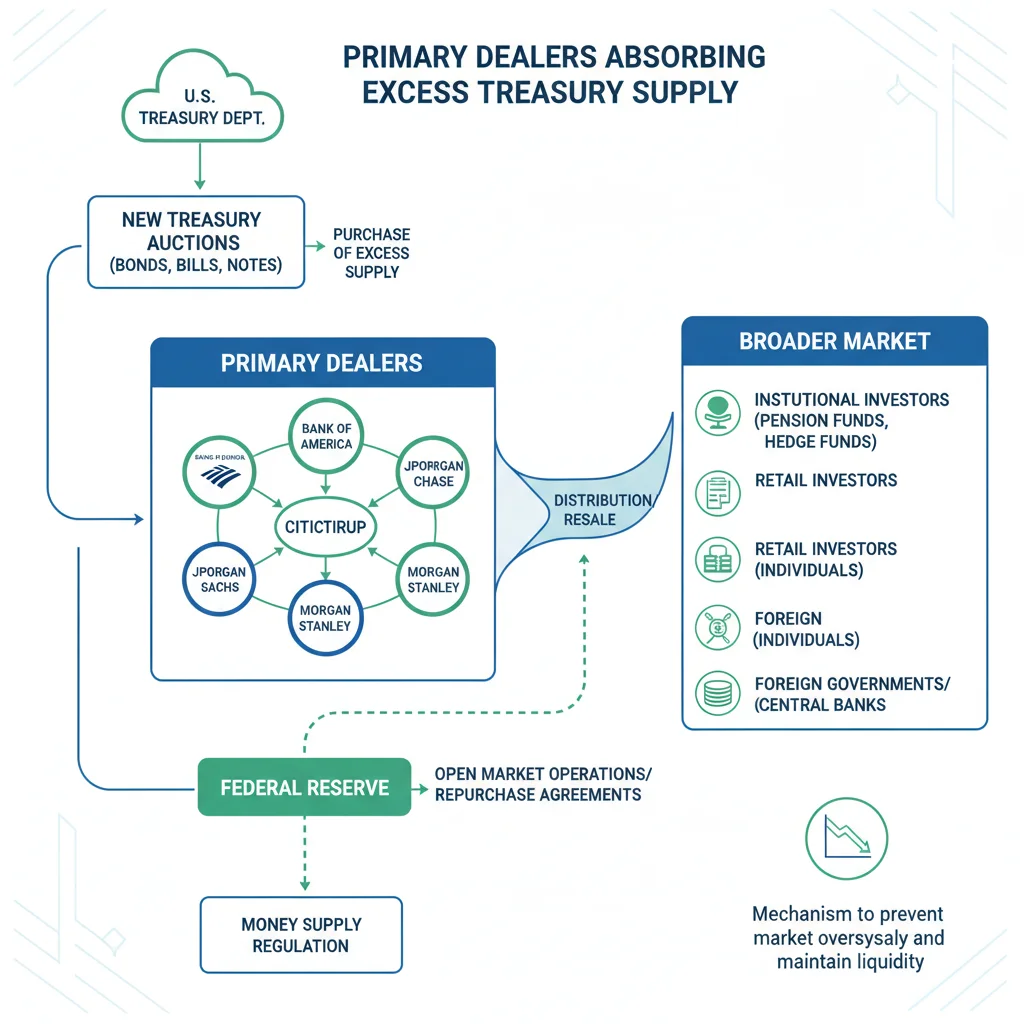
Primary dealers absorbed $42 billion in unsubscribed Treasury securities during July’s unexpectedly weak auctions, the largest dealer take-down since the 2013 taper tantrum. The 10-year note tail of 4.2 basis points exceeded all Wall Street forecasts, with JPMorgan analysts calling it “the most consequential auction miss in a decade” while BlackRock’s fixed-income head noted “structural demand shifts that may persist beyond cyclical factors.”
Auction Mechanics Breakdown
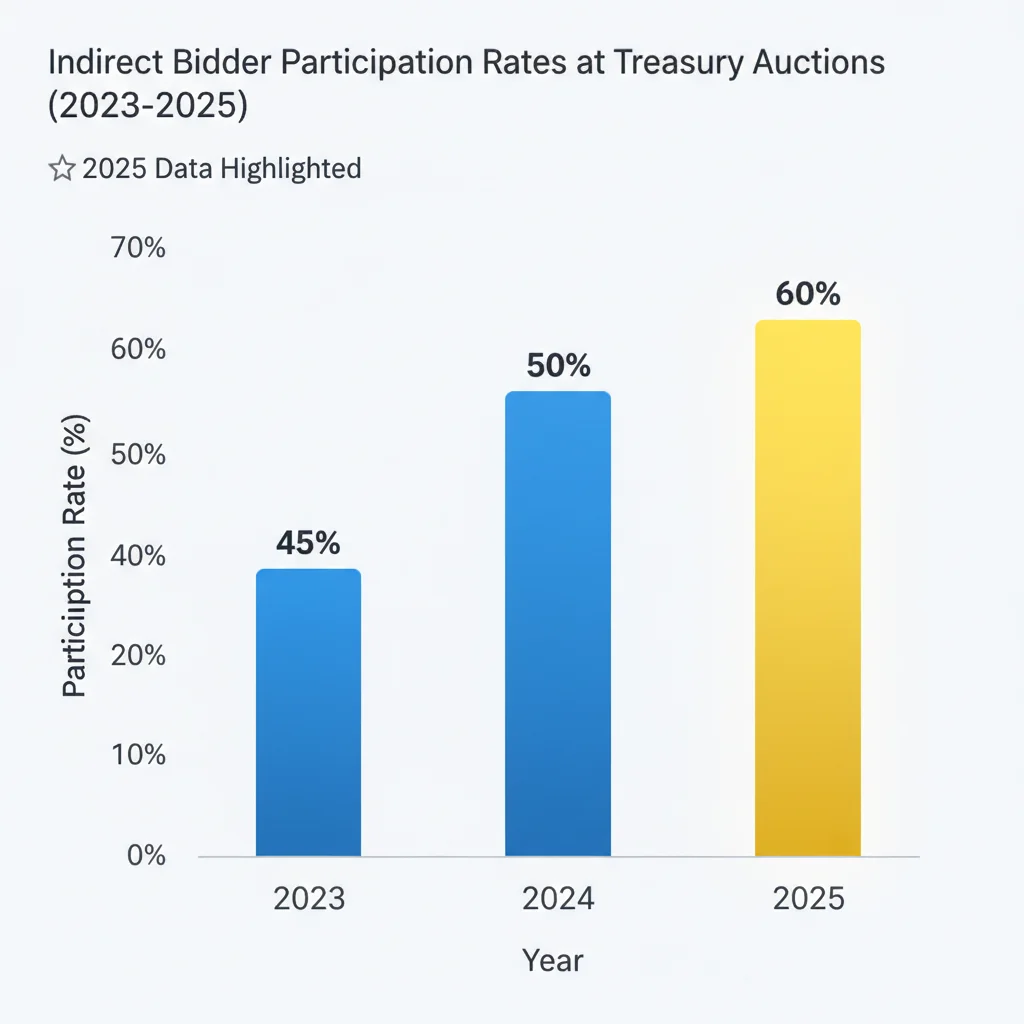
The $126 billion triple offering (3-year, 10-year, 30-year bonds) on July 11-12, 2025 revealed critical stress points. Indirect bidders—typically foreign central banks and institutional investors—captured just 59.3% of 10-year notes versus the 65.8% six-month average, while primary dealers absorbed 24.7% versus their typical 17.2% allocation. The bid-to-cover ratio plunged to 2.07x from 2.42x in June, signaling evaporating demand.
Key Technical Drivers
- Yield dislocation: Auction-clearing yields exceeded WI trading levels by 4.2bps for 10-years, the widest gap since 2018
- Dealer inventory surge: Primary dealer holdings spiked to $42B, exceeding the $30B crisis-era average
- Foreign participation drop: Indirect bids fell 13% year-over-year amid dollar diversification trends
Immediate Market Reactions
The 2s10s yield curve inverted to -65bps within hours of the auction results, the steepest inversion since October 2022. Treasury volatility (MOVE Index) jumped 18% to 124.7, while 10-year futures volumes hit 1.8 million contracts—triple the 30-day average. “This wasn’t a technical correction but a fundamental repricing,” noted Goldman Sachs rates strategist Mark Wilson.
Institutional Positioning Shifts
- Hedge fund net shorts: CFTC data showed leveraged funds increased 10-year short positions to 347,000 contracts
- Dealer hedging pressure: Gamma exposure flipped negative as options markets priced tail risk
- Mortgage convexity flows: Servicers hedged $5.2B in duration risk, amplifying yield moves
Structural Demand Shifts
Foreign official holdings of Treasuries have declined for five consecutive quarters, falling to $3.86 trillion from $4.21 trillion in Q1 2024. Japan’s Ministry of Finance confirmed reduced US duration exposure, while ECB data showed eurozone reserves diversification accelerated. “The ‘exorbitant privilege’ of dollar dominance faces structural pressure,” warned former Treasury official Nathan Sheets.
Policy Driver Analysis
- Fed balance sheet runoff: $95B/month QT continues removing price-insensitive buyer
- SOFR transition: $870B in legacy LIBOR contracts expired June 2025, reducing hedging demand
- Basel III implementation: Bank holding requirements increased Treasury risk weights
Historical Precedents
The July 2025 auction anomalies recall critical market inflection points. The 2013 taper tantrum saw 10-year yields spike 140bps in four months, while 2018’s supply glut triggered “buyer’s strikes” that preceded repo market stress. Current Treasury issuance stands at $2.4 trillion annually versus $1.1 trillion in 2019, amplifying market sensitivity to demand erosion.
Comparative Auction Metrics
- 2013 taper tantrum: 3.9bp average tail vs 2025’s 4.2bp
- 2020 COVID crisis: Dealer absorption peaked at $50B vs 2025’s $42B
- 2022 inflation surge: Indirect bids averaged 63.1% vs 2025’s 59.3%
Monetary Policy Implications
Fed funds futures immediately repriced rate cut expectations post-auction, reducing 2026 easing projections from 125bps to 75bps. “The auction signals market capacity limitations that may force Fed accommodation regardless of inflation,” argued PIMCO’s global fixed-income CIO. The Fed’s SOMA portfolio runoff schedule now faces reconsideration, with Morgan Stanley forecasting QT tapering by Q1 2026.
Yield Curve Projections
- Bear steepening: 2s10s inversion expected to persist through 2026
- Real yield impact: 10-year TIPS yields may breach 2.0% resistance
- Mortgage-Treasury spread: 120bp widening potential from current 90bp
Global Spillover Effects
European sovereign spreads widened as Bund yields followed Treasuries higher, while Japanese lifers faced mark-to-market losses on $1.2 trillion US bond holdings. EM dollar debt issuance stalled with high-yield spreads blowing out 87bps. “The Treasury market remains the global risk-free benchmark—its stress transmits immediately,” noted BIS head of research Hyun Song Shin.
Cross-Asset Correlations
- Dollar index: DXY surged 2.3% as haven flows returned
- Equity valuation: S&P 500 earnings yield gap narrowed to 180bps from 240bps
- Commodity impact: Gold rallied 4.1% as real yields stabilized
Investor Strategy Shifts
Duration hedging costs spiked to 98th percentile levels, forcing pension funds to reconsider liability matching. Active managers increased Treasury shorts to 3:1 versus longs according to BofA surveys, while risk parity funds reduced equity exposure by 12%. “The auction revealed convexity risks that demand portfolio restructurings,” advised Vanguard’s global head of fixed income.
Portfolio Construction Implications
- Barbell strategy: Increased adoption of 2-year/30-year combinations
- Liquidity premium: Front-end Treasuries gaining allocation preference
- Volatility harvesting: Options overwriting strategies surged 32% in AUM
| Auction Metric | Market Implication |
|---|---|
| 59.3% Indirect Bids | Signals structural foreign demand erosion for US debt |
| 4.2bp Tail | Indicates weak price discovery and dealer positioning strain |
| $42B Dealer Absorption | Reflects market-making capacity limits and balance sheet constraints |
| 2.07x Bid-to-Cover | Suggests diminishing marginal demand for Treasury supply |
Frequently Asked Questions about the Treasury Auction Impact
The auction weakness stemmed from three factors: Foreign central banks reduced purchases amid dollar diversification (evidenced by 13% YoY drop in indirect bids), primary dealers approached balance sheet limits ($42B absorption), and hedge funds positioned for higher yields (347,000 net short contracts).
Mortgage-Treasury spreads typically widen 30-50bps during Treasury market stress. Current 90bp spreads could expand to 120-130bps, potentially adding 0.25-0.375% to 30-year mortgage rates independent of Fed policy moves, according to JPMorgan securitization models.
Dealer absorption capacity challenges suggest the Fed may accelerate QT taper discussions. Morgan Stanley forecasts monthly runoff reduction from $95B to $60B by Q1 2026. The Fed’s SOMA portfolio drawdown directly impacts Treasury market liquidity conditions.
Investment-grade spreads widened 17bps post-auction versus 32bps for high-yield. The Treasury yield surge typically transmits to corporates with 0.78 beta historically, but liquidity differentials may cause dispersion. BBB-rated bonds showed greatest sensitivity.
Barbell duration strategies (2s/30s) gained prominence, with Vanguard noting 22% institutional adoption increase. Laddered portfolios extending to 5-years provide yield capture while minimizing curve exposure. Volatility harvesting via options overwriting surged 32% in AUM.
The Bottom Line
The July Treasury auctions revealed structural vulnerabilities in Treasury market absorption capacity that transcend cyclical factors. With foreign demand declining for five consecutive quarters and dealer balance sheets constrained by Basel III, the $2.4 trillion annual supply pipeline faces new scrutiny. Market participants should monitor dealer inventories (above $40B signals stress), foreign reserve diversification patterns, and mortgage convexity flows as leading indicators. While the Fed retains tools to stabilize markets through repo facilities or QT adjustments, the auction suggests yield volatility may persist even amid potential policy pivots.