Small-Cap Valuations at 26% Discount: Opportunity or Warning?
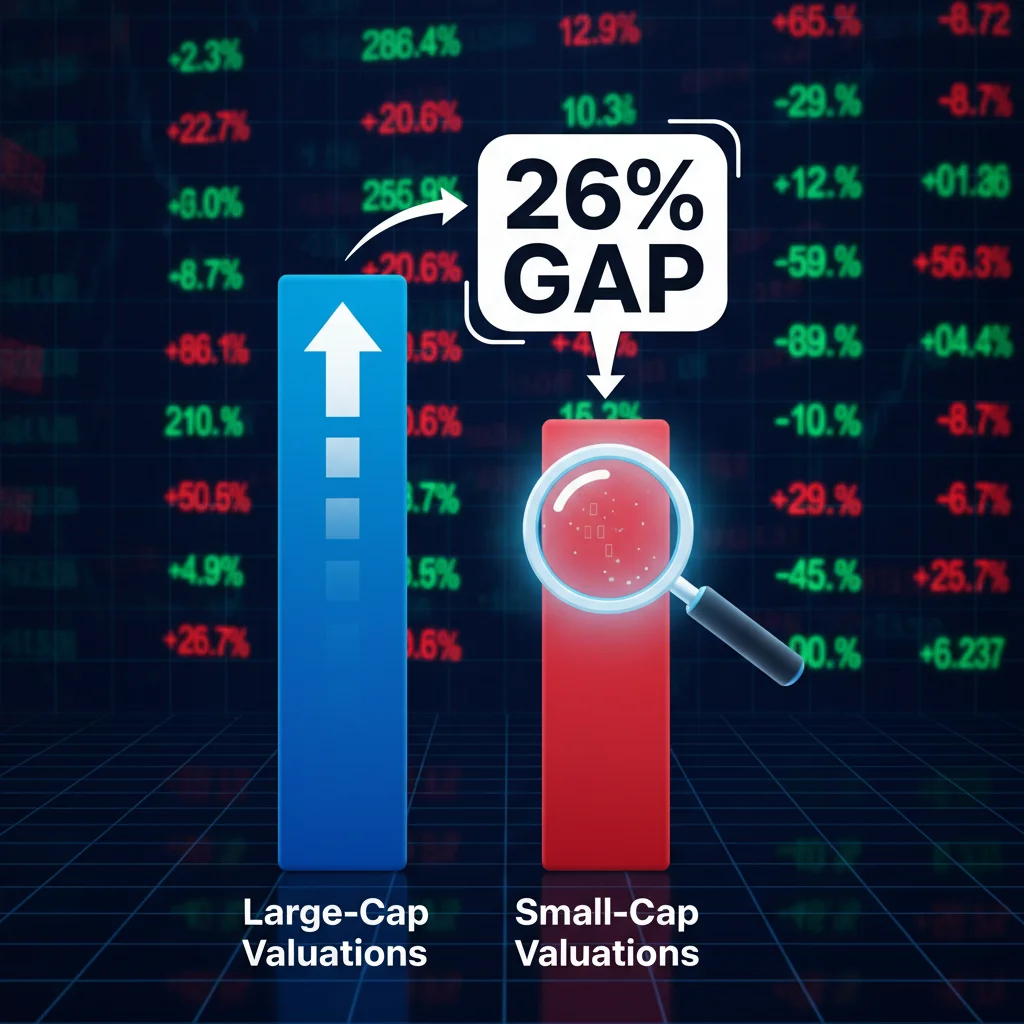
The current 26% discount in small-cap valuation discount relative to large-cap equities is statistically significant, suggesting either a compelling historical opportunity for mean reversion or a justifiable risk premium reflecting sensitivity to higher interest rates and slowing economic growth.
The U.S. equity market is exhibiting one of the most pronounced valuation spreads in recent history. Data compiled by financial institutions, including Goldman Sachs and Bank of America, indicates that the price-to-earnings (P/E) ratio for small-cap companies, typically tracked by the Russell 2000 Index, is trading at a significant 26% discount compared to its large-cap counterpart, the S&P 500. This disparity, which approaches levels only previously seen during major economic dislocations, forces market participants to confront a critical question: is this a hidden buying opportunity underpinned by expected economic normalization, or a stark warning sign reflecting structural vulnerabilities within smaller enterprises?
The mechanics of the 26% valuation gap
The current extreme valuation gap is not merely a cyclical fluctuation; it reflects deep structural forces at play in the post-pandemic, high-inflation environment. Since late 2021, large-cap indices have been driven disproportionately by a handful of mega-cap technology companies, often dubbed the ‘Magnificent Seven,’ whose scale, profitability, and fortress balance sheets offer perceived resilience against macroeconomic headwinds. Conversely, small-cap firms, which are generally more reliant on domestic economic activity and less diversified globally, have struggled under the weight of elevated interest rates and tighter credit conditions.
To put the 26% figure into context, the long-term average P/E relative valuation for small-caps has historically hovered closer to parity or even a slight premium, reflecting their higher growth potential. The current discount is derived from comparing forward P/E ratios, which measure the price relative to expected future earnings. The sheer magnitude of this spread suggests that investors are pricing in significantly higher risk and/or lower future growth for small-caps than for large-caps. This discount primarily stems from the composition of the small-cap index, which includes a higher concentration of companies sensitive to borrowing costs, such as regional banks, real estate, and industrial firms.
Interest Rates and the Cost of Capital
One of the most powerful drivers of this divergence is the Federal Reserve’s sustained policy of higher interest rates. Small-cap companies typically carry higher debt loads relative to their revenue or cash flow compared to large-cap firms. When the federal funds rate was near zero, refinancing debt was inexpensive, facilitating growth. However, with the benchmark rate now significantly higher, the cost of capital has surged, directly impacting small-cap profitability. Analysts at JPMorgan estimate that a 100-basis-point increase in borrowing costs can reduce the earnings of the average small-cap company by an additional 3% to 5% compared to large-caps, where debt costs are often fixed or represent a smaller fraction of operational expenses.
- Debt Sensitivity: Small-caps generally have higher floating-rate debt exposure, making them acutely vulnerable to Fed rate hikes.
- Access to Credit: Smaller firms often rely on regional banks, which have tightened lending standards considerably in the current environment, restricting growth capital.
- Refinancing Risk: A substantial portion of small-cap corporate debt is scheduled to mature over the next 18 months, posing significant refinancing challenges at higher rates.
- Profit Margin Compression: Unlike large, globally diversified companies, small-caps often lack the pricing power to fully pass on rising input costs and labor expenses to consumers, leading to margin erosion.
The persistence of elevated interest rates has created a scenario where the market is demanding a higher risk premium for holding smaller, more leveraged businesses. If the market anticipates a sustained ‘higher for longer’ rate environment, the current small-cap valuation discount may be rationalized, but if rate cuts materialize, the discount presents a significant opportunity for rapid appreciation.
Historical parallels and mean reversion analysis
Analyzing historical periods where the small-cap discount reached similar extremes provides crucial context. Such valuation gaps typically occurred during periods of severe economic stress or uncertainty, such as the 2000 tech bubble burst or the immediate aftermath of the 2008 financial crisis. In both instances, the subsequent market recovery saw small-caps outperform large-caps significantly as economic growth normalized and risk appetites returned.
However, the current situation is unique because the discount exists alongside historically low unemployment and robust (though slowing) GDP growth in the U.S. This suggests the gap is less about immediate recession fears and more about the bifurcation of corporate financial health. The concept of mean reversion is central to the bull case for small-caps. Mean reversion posits that valuations, over time, tend to return to their historical averages. If the underlying economic fundamentals of small-cap businesses are sound, the 26% discount implies a powerful potential catalyst for outperformance once the major headwinds—primarily high interest rates—subside.
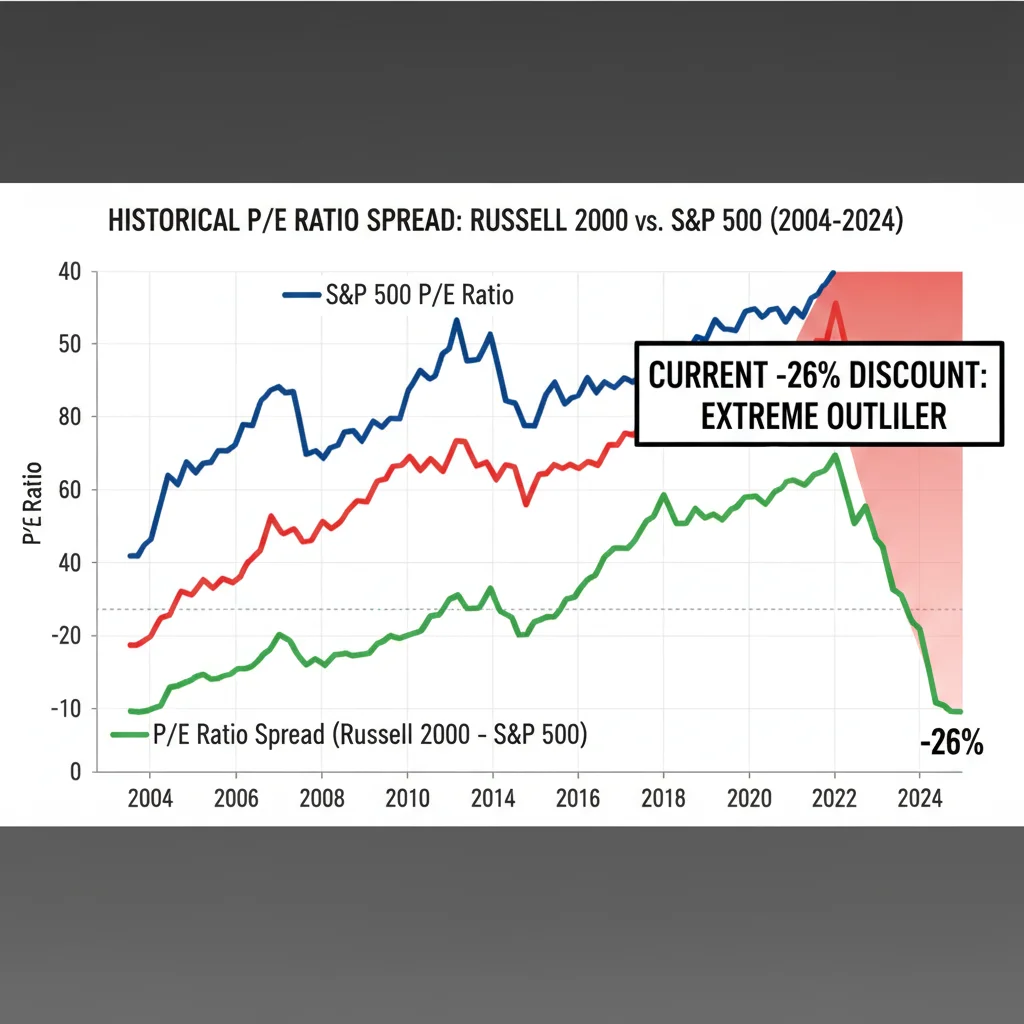
The historical precedent shows that when the Russell 2000 P/E ratio has traded at more than a 20% discount to the S&P 500, the subsequent 12-month returns for small-caps have averaged approximately 18%, significantly outpacing large-cap returns in the same period, according to research from Ned Davis Research. This is the core of the ‘hidden opportunity’ argument: eventually, price must follow value, and the current low valuation offers an attractive entry point for long-term investors.
The Role of Earnings Quality and Cyclicality
While the P/E multiple is compelling, investors must also scrutinize the quality and cyclicality of the underlying earnings. Small-cap earnings are notoriously more volatile than those of large-cap firms. During economic upswings, small-caps often see accelerated earnings growth due to their high operational leverage. Conversely, minor economic slowdowns can disproportionately impact their bottom lines. The current valuation reflects market skepticism regarding small-cap earnings durability should the U.S. economy enter a soft patch in the coming quarters.
- Cyclical Exposure: Small-caps have higher exposure to economically sensitive sectors like materials, industrials, and consumer discretionary, which are first to feel the pinch of reduced consumer spending.
- Recession Pricing: The market is effectively pricing in a greater probability of an earnings recession for the small-cap universe compared to the S&P 500.
- Excluding ‘Zombie’ Firms: A crucial factor is the number of unprofitable companies within the Russell 2000. While the headline discount is 26%, focusing only on profitable small-caps reduces the discount somewhat, but it remains historically wide.
Therefore, the potential for mean reversion is high, but it is contingent upon two key macroeconomic developments: a clear path to Federal Reserve rate cuts and the avoidance of a severe economic downturn that would decimate small-cap earnings. Without these catalysts, the discount could persist longer than historical models suggest.
The warning sign perspective: Credit risk and economic deceleration
The alternative view posits that the 26% discount is not an anomaly but a justified risk premium. This perspective focuses on two primary risks: elevated credit risk and the possibility of a sharper-than-expected economic deceleration in the U.S. economy. Small businesses, particularly those with less than $1 billion in market capitalization, are significantly more susceptible to both factors.
Credit conditions have tightened dramatically. The Federal Reserve’s Senior Loan Officer Opinion Survey (SLOOS) has consistently reported that banks are tightening lending standards across all business sectors, but the impact is most severe on smaller borrowers who lack access to diversified capital markets. This tightening restricts the ability of small-cap firms to invest, manage working capital, and service existing debt. The higher incidence of corporate defaults in the high-yield small-cap segment, reported by agencies like Moody’s and S&P Global, reinforces the market’s caution.
Operational Leverage and Margin Pressure
Small-cap firms often operate with higher operational leverage—a greater proportion of fixed costs relative to variable costs. While this amplifies profits during boom times, it exacerbates losses during downturns. The current environment of persistent labor cost inflation and supply chain complexity means fixed costs remain high, while revenue growth is decelerating. This margin squeeze is a fundamental challenge that cannot be easily overcome, regardless of valuation.
- Labor Costs: Small businesses are disproportionately affected by wage inflation, as labor typically constitutes a higher percentage of their total cost base compared to automated large-cap tech or manufacturing giants.
- Pricing Power Deficit: Lacking the scale of large competitors, small-caps struggle to dictate prices to suppliers or customers, forcing them to absorb cost increases.
- Regulatory Burden: Regulatory compliance costs, while negligible for a mega-cap firm, represent a higher relative burden for resource-constrained small-cap companies.
- Geographic Concentration: Being heavily focused on specific regional or domestic markets, small-caps lack the geographical diversification that insulates large-caps from localized economic weakness.
The warning sign narrative suggests that the market is accurately discounting the potential for significant earnings downgrades or even solvency issues among the most vulnerable small-cap firms. Until the credit cycle eases or the earnings outlook stabilizes, the small-cap valuation discount may simply reflect fundamental reality rather than market mispricing. The divergence between the Russell 2000 and the S&P 500, therefore, acts as a barometer of market confidence in the resilience of the broader, domestically focused U.S. economy.
Sector analysis within the small-cap universe
Treating the entire small-cap universe as a monolith ignores significant performance dispersion beneath the headline index level. The 26% discount is an aggregate figure that masks sectors performing reasonably well and those facing existential pressure. A critical element of smart investing in this environment is granular sector analysis to identify genuine value rather than simply buying the index.
For instance, small-cap technology and healthcare companies, particularly those involved in specialized niche markets or biotechnology, often maintain strong balance sheets and are focused on secular growth trends (e.g., aging demographics, digital transformation). These firms may be dragged down by the overall index valuation but represent high-quality growth opportunities. Conversely, highly leveraged small-cap real estate investment trusts (REITs) and regional banks remain exposed to rising commercial real estate defaults and persistent interest rate volatility.
Identifying Quality at a Discount
Financial analysts at firms tracking the small-cap segment often advise investors to employ a quality filter. This involves screening for companies with robust free cash flow generation, low debt-to-equity ratios (ideally below 0.5), and consistent revenue growth over the last three years, regardless of market cycle. By isolating these ‘quality small-caps,’ the perceived discount relative to large-caps narrows slightly but remains attractive, offering a better risk-adjusted return profile.

- Healthcare/Biotech: Often less cyclical, driven by innovation, and possessing strong intellectual property. Represents a defensive growth pocket within small-caps.
- Industrial Niche: Companies supplying essential components or services to larger industries (e.g., specialized manufacturing) that benefit from government infrastructure spending or onshoring trends.
- Financials (Regional Banks): Currently deeply discounted, but their recovery is wholly dependent on the stability of commercial real estate portfolios and a decline in interest rates. High risk, high potential reward.
- Unprofitable Tech: Many small-cap technology firms rely heavily on future growth projections. While the valuation is low, they are highly sensitive to market liquidity and are generally considered high-risk in the current climate.
This selective approach transforms the broad small-cap valuation discount from a binary question of opportunity or warning into a tactical allocation decision. The opportunity lies not in the index itself, but in the specific, high-quality companies that are currently undervalued due to macro index pressure but possess strong fundamental resilience.
Macroeconomic triggers for small-cap recovery
For the 26% valuation gap to close, a major catalyst must shift capital flows away from the safety and perceived growth of mega-cap stocks and back toward small-caps. The most significant macro trigger would be a definitive shift in Federal Reserve policy toward rate reduction.
Lower interest rates would immediately reduce small-cap borrowing costs, alleviate refinancing pressure, and boost net interest margins for non-financial companies. This scenario would provide an immediate and measurable uplift to small-cap earnings forecasts, thereby justifying a higher P/E multiple and accelerating the process of mean reversion. Consensus estimates from institutions like Wells Fargo suggest that the first Fed rate cut could trigger an immediate 5% to 8% rally in the Russell 2000, assuming stable economic growth.
The Soft Landing Scenario
The ideal scenario for small-cap recovery is a ‘soft landing,’ where inflation returns to the Fed’s 2% target without triggering a full recession. In this environment, economic activity remains positive, supporting small-cap revenue, while lower rates restore profitability. A soft landing validates the current market skepticism about small-cap earnings only to the extent that it reverses the high-rate penalty.
Conversely, a ‘hard landing’ (recession) would likely lead to a temporary further widening of the discount, as earnings estimates for small-caps are slashed more aggressively than those for large-caps. However, historical data shows that small-caps often bottom out and begin their outperformance cycle 6 to 9 months before the official end of a recession, making them a leading indicator of economic recovery.
- Inflation Normalization: Sustained reduction in core inflation below 3% is necessary to give the Fed room to cut rates aggressively.
- Dollar Strength: A weaker U.S. dollar typically benefits small-caps, which are more domestically focused, by reducing competitive pressure from imports. Large-caps with global operations are often negatively impacted by a weaker dollar.
- M&A Activity: Deeply depressed small-cap valuations often spur merger and acquisition activity by larger corporations or private equity funds seeking cheap growth assets, providing an immediate valuation floor for the index.
Monitoring the trajectory of the 10-year Treasury yield, which serves as a proxy for long-term borrowing costs, provides a critical signal. A sustained decline in the 10-year yield below 4.0% would strongly suggest that the market is pricing in the necessary conditions for a small-cap resurgence and the closure of the small-cap valuation discount.
Comparative analysis: Financial health and balance sheet strength
Beyond simple P/E ratios, a deeper dive into financial health metrics confirms why the market is applying such a strong discount. Large-cap companies, particularly those in the S&P 500, have significantly stronger balance sheets, characterized by higher cash reserves and lower net debt-to-EBITDA ratios. This financial fortress allows them to navigate economic uncertainty, invest in expansion, and manage debt maturities without undue strain.
According to data from FactSet, the median small-cap company in the Russell 2000 has a net debt-to-EBITDA ratio approximately 40% higher than the median S&P 500 company. This leverage difference is amplified by the fact that small-cap EBITDA (Earnings Before Interest, Taxes, Depreciation, and Amortization) is itself more volatile. When interest expenses rise, the smaller EBITDA buffer quickly translates into lower net income, justifying the current low valuation multiple applied by the market.
The Dividend Factor and Shareholder Returns
Another structural difference contributing to the valuation gap is shareholder return policy. Many large-cap companies offer consistent, growing dividends and engage in large-scale share repurchase programs, which provide a steady floor for their stock prices and reinforce investor confidence. Small-cap firms, prioritizing reinvestment and growth, typically offer lower, less consistent dividends, meaning their stock performance relies almost entirely on capital appreciation based on future earnings expectations.
This lack of a dividend safety net means small-cap stocks are inherently more volatile and require greater conviction from investors, especially during uncertain economic times. The discount reflects the market’s preference for the steady return profile and balance sheet stability offered by large-caps in the current cycle.
- Cash Flow Conversion: Large-caps demonstrate superior conversion of revenue into free cash flow, providing flexibility for strategic moves or debt repayment.
- Debt Maturity Management: Large-caps have successfully termed out their debt at low rates, locking in favorable financing for several years, whereas small-caps face imminent refinancing at much higher current rates.
- Capital Expenditure (CapEx): Small-caps often have less capacity to fund necessary CapEx through internal cash flow, making them more dependent on external financing, which is currently expensive.
In essence, the small-cap valuation discount is a price tag on financial risk. The market is paying a premium for the certainty of strong balance sheets and established profitability, and demanding a steep discount for the inherent leverage and earnings volatility of smaller companies. The closing of this gap requires not just lower rates, but demonstrable improvement in small-cap cash flow generation and debt management.
Investment implications and risk management strategies
For institutional and individual investors, the 26% valuation discount represents a significant tactical decision point. The risk-reward profile is asymmetric: if the market is correct about the risks, small-caps only fall moderately further; if the market is wrong and mean reversion occurs, the potential upside is substantial, potentially exceeding 30% in the first year of recovery, based on historical precedents.
Given the high degree of uncertainty regarding the timing and magnitude of Fed rate cuts, a balanced approach combining patience with selective exposure is prudent. Investors should avoid broad index exposure and instead focus on index-tracking funds that employ quality filters or actively managed small-cap strategies that can navigate the sector-specific risks. Risk management in this environment centers on liquidity and minimizing exposure to deeply unprofitable firms that may not survive a sustained high-rate period.
Strategic Allocation Considerations
Portfolio managers are increasingly emphasizing a barbell strategy: maintaining core exposure to resilient large-cap quality while initiating tactical, quality-focused positions in small-caps. This strategy aims to capture potential mean reversion without exposing the entire portfolio to the credit and earnings risks inherent in the broader small-cap index (Russell 2000).
Furthermore, investors may consider incorporating market timing indicators, such as the inversion of the yield curve (which often precedes small-cap outperformance following its normalization) or significant shifts in the SLOOS data indicating an easing of credit standards. The current environment demands a higher level of due diligence and active management than passive index investing.
- Active Management Preference: Given the divergence in sector performance and financial health, active small-cap funds have a statistical advantage over passive index funds.
- Focus on Free Cash Flow: Prioritize small-caps with positive and growing free cash flow, as this indicates resilience against credit tightening.
- Hedge Against Rate Risk: Use duration-sensitive instruments to hedge against the risk of continued high interest rates, which disproportionately hurts small-cap valuations.
- Long-Term Horizon: The small-cap recovery is unlikely to be immediate. Investors should adopt a minimum three-to-five-year time horizon to realize the full benefit of the current valuation discount.
Ultimately, the small-cap valuation discount is a litmus test for investor conviction in the future trajectory of U.S. monetary policy and economic health. While the discount screams ‘opportunity’ on a raw valuation basis, the underlying financial fragility of many small-cap constituents necessitates a cautious, quality-driven approach to realize those potential gains.
| Key Metric | Market Implication/Analysis |
|---|---|
| Valuation Discount (26%) | Indicates extreme undervaluation relative to historical averages; potential for significant mean reversion if macro conditions improve. |
| High Interest Rates | Primary driver of the discount; increases small-cap debt servicing costs and restricts access to capital, depressing P/E multiples. |
| Credit Tightening (SLOOS) | Banks restricting lending exacerbates small-cap financial fragility; justifies the risk premium applied by the market. |
| Earnings Volatility | Small-cap earnings are highly cyclical; a soft landing is necessary for a sustained recovery, otherwise, valuation gaps may persist. |
Frequently Asked Questions about Small-cap valuation discount
The primary driver is the elevated cost of capital due to high Federal Reserve interest rates. Small-cap firms are typically more leveraged and sensitive to borrowing costs, leading investors to demand a higher risk premium, which translates directly into a lower price-to-earnings multiple compared to large-cap firms.
Historically, when the small-cap valuation discount exceeds 20%, subsequent 12-month returns for small-caps have significantly outperformed large-caps, averaging around 18%. This supports the mean reversion theory, provided that the U.S. avoids a severe recession and rates begin to normalize.
Investors should apply quality filters, prioritizing small-cap companies with strong balance sheets, defined by low debt-to-EBITDA ratios (below 0.5) and consistent positive free cash flow generation. This mitigates the risk associated with highly leveraged or unprofitable firms in the index.
A definitive shift in Federal Reserve policy toward rate cuts is the most significant catalyst. Lower rates would reduce small-cap debt burdens and boost earnings expectations, leading to rapid multiple expansion and closing the small-cap valuation discount relative to large-caps.
Yes, a hard landing would justify the discount, as small-cap earnings would likely be cut more severely than large-cap earnings due to higher operational and financial leverage. In this scenario, the discount reflects necessary compensation for higher expected default and earnings volatility risk.
The bottom line: Navigating the small-cap disparity
The current small-cap valuation discount of 26% is statistically compelling, yet fundamentally complex. It is a dual signal: an undeniable historical opportunity for outsized returns once the macroeconomic environment pivots, and a genuine warning reflecting the heightened financial fragility of smaller, debt-exposed firms under persistent high interest rates. The resolution of this disparity hinges almost entirely on the path of U.S. monetary policy. Should the Federal Reserve successfully engineer a soft landing and initiate rate normalization, the discount will likely compress rapidly, rewarding patient, quality-focused investors. However, if rates remain elevated and credit tightening continues, the risk premium is justified, and selective exposure is paramount. Investors must monitor credit markets, particularly regional bank lending standards and corporate default rates, as these will serve as leading indicators for the small-cap universe’s recovery potential.