
Bitcoin Drops Below $86,000: Explaining Crypto Market Instability
Bitcoin's steep 6% decline, pushing its price below $86,000, underscores persistent market instability driven by tightening global liquidity, increasing regulatory scrutiny, and significant whale movements, challenging the recent bullish narrative.

Bitcoin Below $91,000: December Trading Watch List
The sharp decline as Bitcoin drops below $91,000 signals heightened volatility, compelling traders to prioritize technical support levels, monitor Federal Reserve interest rate guidance, and assess institutional accumulation trends throughout December.

S&P 500’s 17.19% Gain: REIT Implications and Market Outlook
The S&P 500’s robust 17.19% YTD return signals strong equity market health but creates a complex environment for Real Estate Investment Trusts (REITs), depending heavily on monetary policy direction and specific sector performance, particularly industrial and data center REITs.

Senior Housing Shortage: The $300 Billion Investment Gap
The confluence of rapidly aging US demographics and insufficient capital allocation has created a critical senior housing investment gap estimated at $300 billion, demanding immediate and strategic private and public sector intervention to avoid a looming social and economic crisis.

Tax-Loss Harvesting Strategies: Optimizing Portfolios for 2026
Effective tax-loss harvesting strategies are crucial year-end maneuvers; strategic utilization of realized losses against capital gains can potentially reduce investors' taxable income by up to $3,000 annually, maximizing after-tax returns for the 2026 tax year and beyond.

Broadcom Stock Tumbles 4.3%: AI Sector Correction or Pullback Signal?
Following a 4.3% single-day decline, the Broadcom stock tumble has intensified scrutiny on the sustainability of AI-driven semiconductor valuations, prompting investors to assess whether this signals a temporary technical pullback or the start of a deeper sector-wide correction.
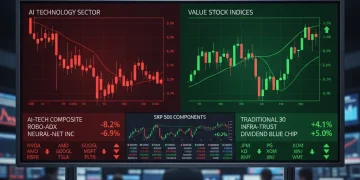
S&P 500 rotation away from AI stocks: December market shift impact
The S&P 500 experienced a significant rotation away from artificial intelligence stocks in December 2025, shifting investor capital toward value and defensive sectors amid concerns over AI valuation sustainability and macroeconomic headwinds.

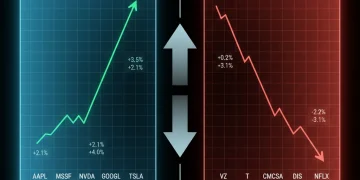
Healthcare stocks surge 9.3% as tech retreats: what’s driving the sector rotation
Healthcare stocks rallied 9.3% amid a sector rotation out of technology, which declined 4.8%, reflecting investor reassessment of valuations, interest rates, and defensive positioning in a shifting economic environment.

AI electricity inflation: how data center demand is spiking your power bills
Electricity inflation is accelerating as artificial intelligence data centers demand record amounts of power, pushing grid strain and household energy bills higher. Industry analysts project energy-intensive AI workloads could increase U.S. electricity consumption by 10-15% within five years, creating significant cost pressures for both consumers and utilities.

Healthcare Led Markets with 9.29% Gain in November While Tech Slipped 4.81%
Healthcare equities delivered a 9.29% gain in November as investors rotated into defensive sectors, while technology stocks retreated 4.81%, signaling a significant shift in market leadership and investor risk appetite.
Tech communications divergence: why market split shocked investors
The technology sector's significant outperformance against communications stocks in 2025 reflects structural shifts in AI adoption, valuation dynamics, and interest rate sensitivity rather than temporary market noise.
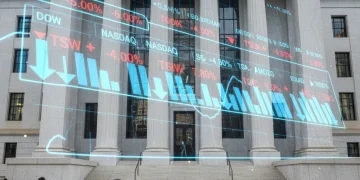
Surprise Employment Data Shakes Markets: Key Analysis
This week's unexpectedly strong employment report showed 312,000 new jobs versus 180,000 forecast, triggering Treasury yield spikes and equity sell-offs. We analyze the data sources, sector anomalies, and revised Fed rate expectations driving market turbulence.