
Mixed December Data Tests Record-High Rally’s Sustainability
The convergence of robust labor market figures, specifically non-farm payrolls exceeding forecasts by 50,000, and decelerating core inflation metrics in December created a pivotal moment, testing the endurance of the current equity market rally amid re-evaluation of the Federal Reserve's rate path.

Value Stocks Surge 3% While Growth Falls 2.4%: What’s Next?
The sharp 3% surge in value stocks in November, juxtaposed against a 2.4% decline in growth stocks, signals a potential rotation driven by shifting interest rate expectations and resilient economic data, compelling investors to re-evaluate portfolio allocations.

Unemployment Rate Hits 4.4%: Job Market Signals Weakness Ahead
The surge in the unemployment rate 4.4% has shifted the economic narrative from tight labor conditions to emerging weakness, prompting analysts to reassess corporate earnings forecasts and the likelihood of Federal Reserve interest rate adjustments in the near term.

PCE Inflation at 2.8%: Tax Planning Strategies for 2025
As the Personal Consumption Expenditures (PCE) index settles near 2.8%, below the Federal Reserve’s long-term target, proactive year-end tax planning becomes crucial for maximizing deductions, strategically managing investment gains, and optimizing retirement contributions ahead of the 2025 fiscal year.
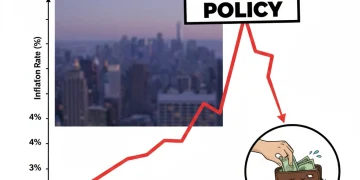
Trump’s Tariffs: 0.5% Inflation Impact on US Wallets
Proposed trade policies, specifically substantial tariff increases advocated by former President Trump, are widely projected by economic models to add approximately 0.5 percentage points to the core US inflation rate, directly eroding household purchasing power and complicating the Federal Reserve’s monetary policy path.

First-Time Buyers Average 40: Analyzing the Housing Affordability Crisis
The sharp increase in the average age of first-time homebuyers to 40 reflects a critical failure in the housing market, driven by a convergence of high median home prices, restrictive borrowing costs imposed by Federal Reserve policy, and persistent inventory shortages.

Fixed Income Rally: Intermediate Bonds Return 7.5% Through 2025
The anticipated shift in Federal Reserve policy is driving a powerful Intermediate Bonds Rally, with projections indicating a 7.5% return through November 2025, fueled by falling yields and robust demand for duration.
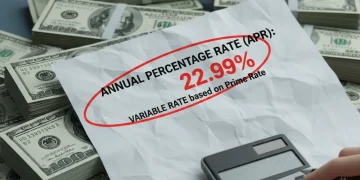
Credit Card Rates Exceed 22%: Three Strategies to Escape Debt Now
Record-high credit card APRs, now exceeding 22%, necessitate immediate and aggressive action; implementing strategies like balance transfers or debt consolidation loans can significantly mitigate the crushing effect of compounding interest on consumer liabilities.

Bitcoin Volatility: Should You Allocate More Than 2% to Crypto Now?
While Bitcoin’s year-to-date volatility has exceeded 65% annualized, strategic asset allocators are debating whether institutional adoption, driven by spot ETFs, justifies exceeding the traditional 1%-2% portfolio cap for high-net-worth clients, emphasizing risk-adjusted returns.

Consumer Confidence Declining 28%: Holiday Spending Drop Looms
The sharp 28% decline in US consumer confidence declining signals a challenging holiday shopping season, with forecasts indicating a significant drop in discretionary spending as households prioritize essential goods amid elevated inflation and constrained credit.