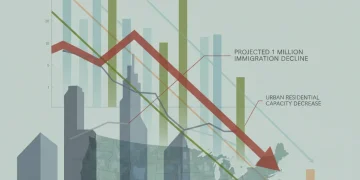
Immigration Decline 1 Million in 2025: Housing Market Impact
The projected 1 million reduction in US immigration for 2025 is set to significantly decelerate housing demand growth, potentially easing rental price pressures in key gateway cities like New York and Los Angeles, according to economic models.

Rent Deceleration Signals Fed Relief: What Renters Should Do Now
The ongoing deceleration in U.S. rental price growth is emerging as a primary disinflationary force, significantly impacting the core Consumer Price Index (CPI) and bolstering expectations for a less restrictive Federal Reserve monetary policy.

The 30% Housing Affordability Rule is Broken: New Reality for First-Time Buyers
The conventional 30% housing affordability threshold is structurally broken, forcing first-time buyers in major US metropolitan areas to allocate up to 45% of their pre-tax income to basic housing costs due to elevated interest rates and sustained home price appreciation.
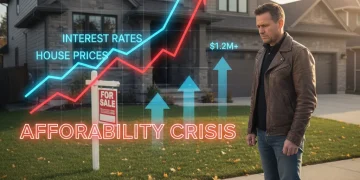
40-Year-Olds Struggle: Housing Affordability Crisis Deepens
The confluence of Federal Reserve rate hikes driving 30-year fixed mortgage rates above 7%, coupled with persistent low housing inventory and real wage stagnation, has rendered homeownership inaccessible for many 40-year-olds relying on first-time buyer market conditions.

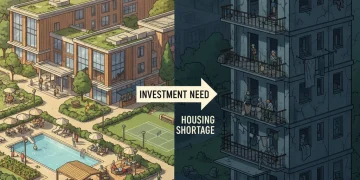
Goldman Sachs: US Housing Shortage Requires 3-4 Million More Homes by 2030
Goldman Sachs' recent analysis underscores a critical need for the US to construct between 3 and 4 million additional housing units by 2030 to address the structural supply deficit, mitigating upward pressure on home prices and improving affordability across key metropolitan areas.
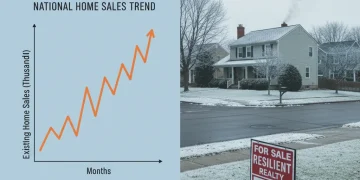
Existing Home Sales Up 1.2%: Cooling Markets Analysis
The unexpected 1.2% increase in existing home sales during October signals persistent demand despite the highest mortgage rates in two decades, forcing analysts to re-evaluate the trajectory of market cooling, particularly in high-demand, low-inventory regions.

NAR Settlement: Impact on Real Estate Agent Commissions and Housing Costs
The landmark NAR settlement mandates significant changes to buyer agent compensation rules, potentially driving down average commission rates from the historical 5.5% to 6% range, fundamentally reshaping transaction costs for US real estate consumers.

S&P 500’s 17.19% Gain: REIT Implications and Market Outlook
The S&P 500’s robust 17.19% YTD return signals strong equity market health but creates a complex environment for Real Estate Investment Trusts (REITs), depending heavily on monetary policy direction and specific sector performance, particularly industrial and data center REITs.
Senior Housing Shortage: The $300 Billion Investment Gap
The confluence of rapidly aging US demographics and insufficient capital allocation has created a critical senior housing investment gap estimated at $300 billion, demanding immediate and strategic private and public sector intervention to avoid a looming social and economic crisis.

Mortgage Rates at 5.99%: Refinance Analysis and Market Outlook
The 5.99% mortgage rate threshold presents a complex refinancing decision driven by homeowners' current rate, the cost of closing, and expectations regarding the Federal Reserve's future monetary policy trajectory into 2025.