10-Year Treasury Yield at 4.02%: Fixed Income Allocation Guide

The stabilization of the 10-year Treasury yield at 4.02% establishes a new baseline for risk-free rates, compelling sophisticated investors to structurally adjust their fixed income portfolios by favoring shorter duration and high-quality credit segments in anticipation of potential Federal Reserve rate cuts in mid-2025.
The stabilization of the 10-year Treasury yield at 4.02%: Fixed income allocation decisions for next year have become paramount for institutional and individual investors alike. This specific yield level—achieved following a period of intense volatility driven by shifting Federal Reserve guidance and persistent inflation data—redefines the opportunity cost of capital and necessitates a rigorous reevaluation of portfolio construction for 2025. This rate provides a crucial benchmark against which all other fixed income assets, including corporate bonds, municipal debt, and mortgage-backed securities, are priced, fundamentally influencing expected returns and duration risk profiles across the entire asset class.
The macroeconomic backdrop: inflation, the Fed, and the 4.02% anchor
The 4.02% yield mark on the benchmark 10-year Treasury note is not an isolated data point; it is the culmination of concerted monetary policy tightening by the Federal Reserve aimed at curbing inflation. As of the latest CPI release, headline inflation stood at 3.3% year-over-year, significantly down from its peak but still above the Fed’s 2.0% target. This persistent inflation, coupled with a robust employment market—evidenced by the unemployment rate holding near 3.8%—has kept the Fed in a ‘higher for longer’ stance, pushing term premia higher and anchoring the long end of the curve near 4.0%. Market participants are currently pricing in a 65% probability of the first rate cut occurring no earlier than the June 2025 FOMC meeting, according to CME FedWatch data, providing context for the current yield environment.
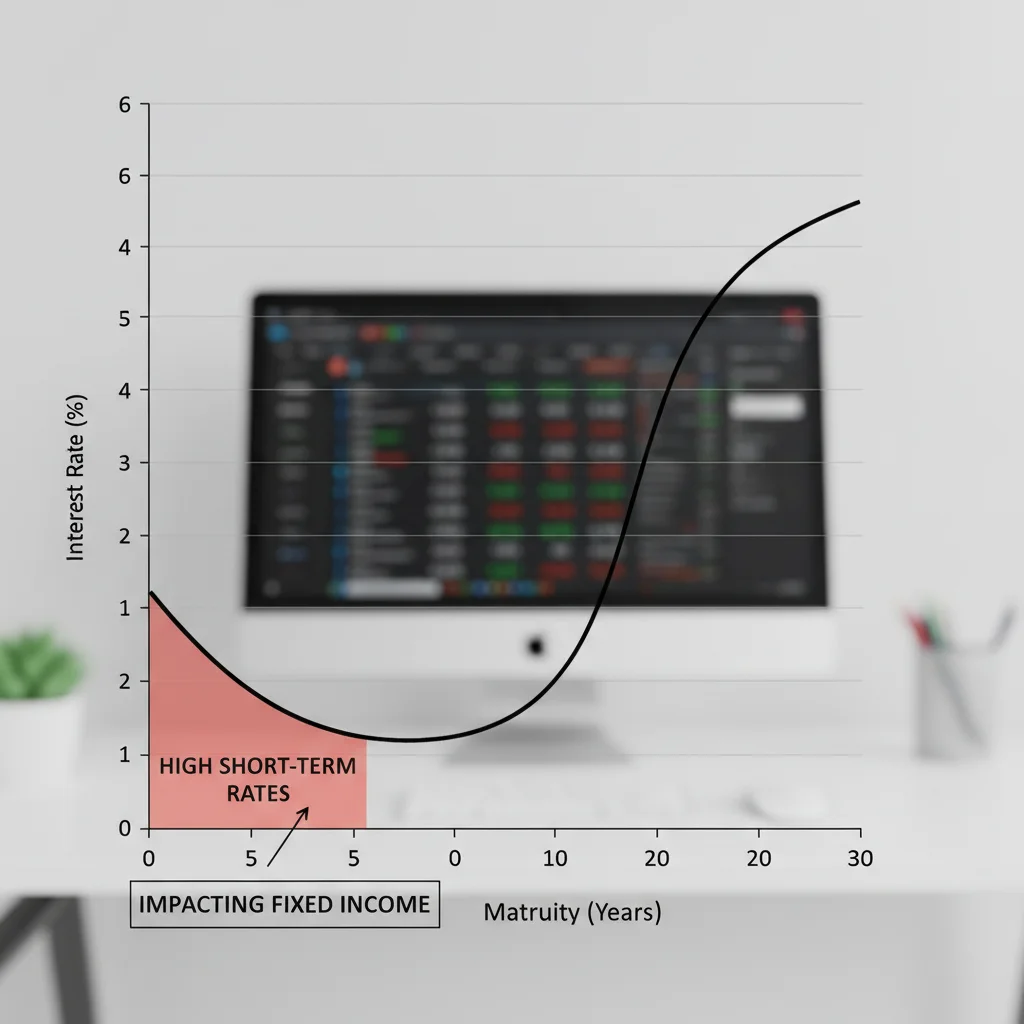
The current state of the yield curve presents a complex picture. While the 10-year Treasury sits at 4.02%, the 2-year Treasury yield often hovers slightly higher, suggesting an ongoing, albeit less severe, inversion. This inversion signals market apprehension regarding future economic growth, despite the Fed’s aggressive posture on inflation fighting. The difference between the 10-year and 3-month Treasury yields, a historically reliable recession indicator, remains compressed, reinforcing the need for caution in long-duration fixed income exposure.
Duration risk management in a 4.02% environment
Duration, the measure of a bond’s price sensitivity to changes in interest rates, becomes a critical variable when the Fed’s path is uncertain. With the 10-year yield at 4.02%, the primary risk is that sustained economic strength or renewed inflationary pressures could push yields higher, leading to capital losses for existing bondholders. Conversely, a sharp economic slowdown could trigger a flight to safety, driving yields down and increasing bond prices. Analysts at Goldman Sachs suggest that portfolios with an average duration exceeding five years face disproportionately higher interest rate risk relative to their yield pickup.
- Short-Duration Preference: Many investment banks recommend positioning fixed income portfolios with average durations between 2.5 and 4 years to capture attractive current yields without excessive exposure to potential rate hikes.
- Barbell Strategy Consideration: A barbell approach—holding both very short-term (under 1 year) and very long-term (over 15 years) bonds while avoiding the intermediate range—is gaining traction, allowing flexibility to capitalize on either immediate liquidity or potential future yield compression.
- Zero-Coupon Bond Evaluation: Zero-coupon bonds, which have high duration, should be approached cautiously. While they offer substantial upside if rates fall, the volatility associated with their long duration can erode capital quickly if the 4.02% level proves to be a temporary floor.
The consensus among fixed income strategists at institutions like PIMCO and BlackRock is that the 4.02% level offers a significant opportunity to lock in higher yields than those available over the past decade. However, this must be balanced against the risk of capital erosion if rates move further north. The decision hinges on an investor’s forward-looking view of inflation and the terminal rate for the current tightening cycle.
Revisiting credit quality and spread compression
In a 4.02% Treasury environment, the focus shifts to the additional return—the spread—investors receive for taking on credit risk (default risk) in assets like corporate bonds. Historically, when the risk-free rate is high, corporate bond spreads tend to tighten as investors seek incremental yield. However, the economic outlook dictates the risk tolerance associated with corporate debt.
Current investment-grade corporate bond spreads average approximately 120 basis points over comparable Treasuries, according to ICE BofA data. This implies that a high-quality corporate bond with a 10-year maturity might yield around 5.22%. High-yield (junk) bonds, conversely, offer spreads averaging 450 basis points, pushing yields into the 8.5% to 9.0% range. While these high yields are tempting, the risk of a recession—even a mild one—increases the probability of defaults, making careful credit selection essential.
The appeal of high-quality corporate debt
For investors prioritizing capital preservation while seeking yields above the Treasury benchmark, high-quality corporate debt (rated AAA to A) provides a compelling middle ground. These bonds generally exhibit lower volatility than equities and offer a meaningful yield pickup over Treasuries without the significant default risk associated with lower-rated debt. The current spread environment suggests that the market is relatively sanguine about the immediate default outlook for major corporations.
The challenge for fixed income allocation is determining whether the current spreads adequately compensate for the embedded economic risks. Analysts at JPMorgan Chase & Co. argue that while investment-grade spreads are tight, the underlying financial health of many corporations remains strong, supported by solid Q3 2024 earnings reports. They advise maintaining exposure to sectors with robust free cash flow and low leverage ratios, such as technology and healthcare.
- Sector Focus: Prioritize corporate bonds issued by companies in non-cyclical industries (utilities, essential services) that can consistently generate revenue regardless of minor economic fluctuations.
- Maturity Laddering: Implement a maturity laddering strategy for corporate bonds, ensuring that principal is reinvested at potentially higher rates as short-term bonds mature, mitigating the risk of locking in current rates for too long.
- Credit Cycle Monitoring: Closely monitor leading economic indicators, such as the ISM Manufacturing Index and corporate default rates, as early signs of a deteriorating credit cycle would necessitate a rapid shift from corporate debt back into Treasuries.
The risk of being overly aggressive in the high-yield space, particularly with the 10-year yield at 4.02%, is that any economic deceleration could trigger a widening of spreads, leading to mark-to-market losses. Prudence dictates maintaining high average credit quality while strategically selecting individual high-yield names based on fundamental analysis rather than broad market exposure.
Municipal bonds and tax-equivalent yield analysis
For high-net-worth individuals and taxable accounts, municipal bonds (munis) offer a crucial component of fixed income allocation, particularly with the 10-year Treasury yield at 4.02%. The primary appeal of munis is their tax-exempt status at the federal level, and often at the state and local levels for residents of the issuing state.
When the 10-year Treasury yields 4.02%, the tax-equivalent yield (TEY) of a comparable A-rated municipal bond yielding, say, 3.20%, can be significantly higher for investors in top tax brackets. For an investor facing a combined federal and state marginal tax rate of 37%, the 3.20% muni yield translates to a TEY of approximately 5.08% (3.20% / (1 – 0.37)). This comparison clearly illustrates the superior after-tax return offered by munis relative to taxable Treasuries or corporate bonds for certain investors.
Assessing municipal credit risk
While generally perceived as safe, municipal credit quality is not uniform. The creditworthiness of municipal issuers depends heavily on local economic conditions, population trends, and revenue sources (e.g., property taxes, sales taxes). General obligation (GO) bonds, backed by the full faith and credit of the municipality, generally carry lower risk than revenue bonds, which are dependent on specific project revenues (e.g., toll roads, utility systems).
Fitch Ratings and Moody’s Investors Service have highlighted increased scrutiny on munis tied to state pension liabilities and specific infrastructure projects. Investors must perform due diligence on the issuer’s fiscal health. S&P Global Ratings recently noted that municipal finances, on average, are robust, supported by significant federal aid distributed during the pandemic, but localized risks persist in regions with declining tax bases.
- Revenue Bond Scrutiny: Carefully analyze the revenue streams backing specific revenue bonds. Bonds financing essential services (water, sewer) are typically safer than those tied to discretionary projects (stadiums, arts centers).
- State-Specific Risk: Consider the financial health and potential liabilities of the state where the bond is issued. States with large unfunded pension liabilities or reliance on volatile revenue sources (like oil and gas severance taxes) may pose greater long-term risk.
- Tax Efficiency Maximization: Focus on high-grade, long-term munis (15-20 years) to maximize the tax-free compounding effect, particularly when the 10-year Treasury yield provides a solid benchmark for comparison.
The ongoing high yield environment, with the 10-year Treasury at 4.02%, makes the tax-efficient nature of municipal bonds more valuable than when yields were near historic lows. Strategists recommend an overweight position in high-quality munis for tax-sensitive portfolios as a core component of the 2025 fixed income strategy.
TIPS and inflation protection strategies
Treasury Inflation-Protected Securities (TIPS) are a crucial tool in fixed income allocation when inflation remains a central concern, even if the 10-year nominal yield sits at 4.02%. TIPS principal value adjusts with the Consumer Price Index (CPI), providing a hedge against unexpected inflation.
The real yield on TIPS (the yield after adjusting for expected inflation) is currently hovering around 1.8%. The difference between the nominal 10-year Treasury yield (4.02%) and the 10-year TIPS real yield (1.8%) is the market’s implied inflation expectation, or the breakeven rate, which is approximately 2.22%. This rate suggests the market believes average inflation over the next decade will be 2.22%.
Evaluating the breakeven rate
If an investor believes that actual average inflation over the next 10 years will exceed 2.22%, TIPS are a superior investment compared to nominal Treasuries. Conversely, if inflation falls below this breakeven rate, the nominal 4.02% Treasury offers a better return. Given the Federal Reserve’s stated commitment to bringing inflation down to 2.0%, the current breakeven rate is finely balanced.
However, the risk is asymmetric. Central bank efforts may successfully reduce goods inflation, but services inflation, driven by sticky wage growth, remains elevated. This structural stickiness in services prices could push average inflation above 2.22%, making TIPS a necessary diversification tool. Bank of America Global Research advises maintaining a modest but consistent allocation to TIPS, perhaps 10% to 15% of the total fixed income portfolio, as an insurance policy against policy error or geopolitical supply shocks that could reignite price pressures.
The attractiveness of TIPS is enhanced by the fact that they offer a positive real yield (1.8%), something that was absent for prolonged periods during the quantitative easing era. This positive real return ensures that investors are not losing purchasing power, even if nominal yields remain volatile.
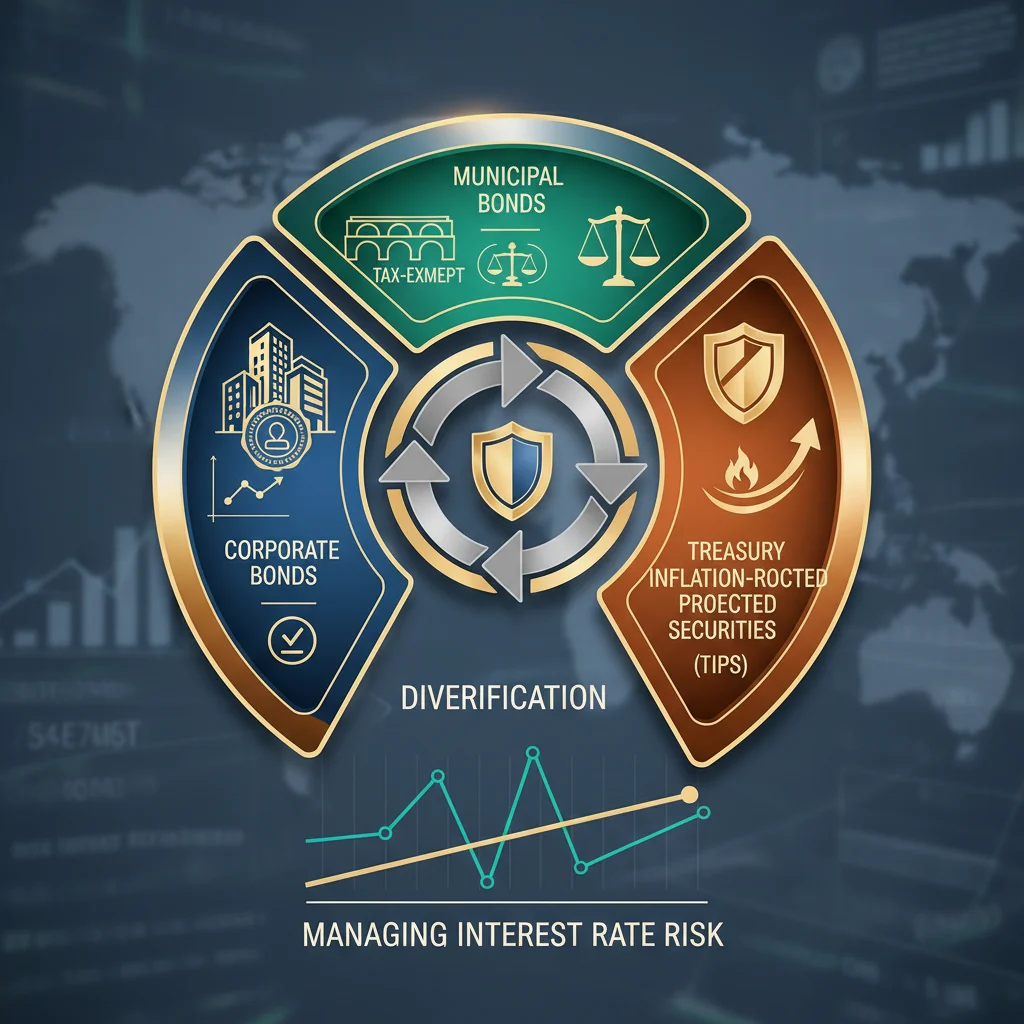
Exploring structured products and non-traditional fixed income
Beyond traditional government and corporate bonds, the 4.02% Treasury yield environment encourages sophisticated investors to explore structured products and non-traditional assets to enhance yield and diversification. These include mortgage-backed securities (MBS), collateralized loan obligations (CLOs), and floating-rate notes.
Mortgage-backed securities (MBS) and prepayment risk
Agency MBS, issued by entities like Fannie Mae and Freddie Mac, offer significantly higher yields than Treasuries (often 50-100 basis points more) while carrying minimal credit risk, as they are implicitly backed by the U.S. government. However, MBS introduce prepayment risk: if interest rates fall, homeowners refinance their mortgages, forcing the investor to reinvest the principal at lower prevailing rates. Conversely, if rates rise, the duration of the MBS extends, increasing price volatility.
With the 10-year yield at 4.02%, prepayment risk is currently low, as most existing mortgages carry rates significantly higher than this level. This makes agency MBS an attractive option for yield enhancement, provided investors are comfortable with the unique duration dynamics. Strategists at Wells Fargo Securities suggest that agency MBS currently offer one of the best risk-adjusted returns within the high-quality fixed income universe.
The role of floating-rate notes and CLOs
Floating-rate notes (FRNs) are debt instruments whose coupon payments adjust periodically based on a reference rate (like SOFR or the Fed Funds rate). They are highly attractive in a rising or high-rate environment because their prices remain relatively stable, effectively neutralizing duration risk. As the Federal Reserve maintains short-term rates near 5.5%, FRNs offer resilient income.
- CLOs as Yield Drivers: Collateralized Loan Obligations (CLOs), which pool leveraged loans, offer equity-like returns in their riskier tranches but have higher-rated tranches (AAA) that provide substantial yield pickup over Treasuries—often 150-200 basis points. The risk here is corporate default within the underlying loan pool, although AAA tranches have historically exhibited strong resilience.
- Active Management Requirement: Investing in CLOs and complex structured products necessitates active management and deep credit analysis, as market liquidity can be volatile, and individual credit selection is critical.
- Hedge Funds and Private Debt: Increased institutional capital is flowing into private credit and debt funds, seeking returns uncorrelated with public bond markets. However, these investments carry liquidity premiums, requiring longer lock-up periods.
The 4.02% Treasury yield serves as a foundational metric, but the search for incremental yield and diversification leads sophisticated investors into these non-traditional segments. The key is understanding that these assets trade interest rate risk for credit risk or liquidity risk, requiring meticulous due diligence.
Strategic positioning: duration, convexity, and the yield curve
Fixed income portfolio strategy for the upcoming year must synthesize the macroeconomic outlook with technical bond characteristics, focusing on duration and convexity. Convexity measures how the duration of a bond changes as interest rates change, providing insight into the bond’s price performance during extreme rate movements.
As the 10-year yield stabilizes at 4.02%, strategists generally favor positive convexity, meaning a bond’s price increases more when yields fall than it decreases when yields rise. Callable corporate bonds, which can be redeemed early by the issuer, often exhibit negative convexity and should be approached with caution in anticipation of potential rate cuts, as the issuer is likely to call the bond when rates drop.
Scenario analysis for 2025 fixed income allocation
Financial institutions are modeling fixed income returns based on three primary scenarios for 2025, all anchored around the current 4.02% 10-year Treasury yield:
- Soft Landing (Base Case – 60% Probability): Inflation gradually recedes towards 2.5%; the Fed implements 2-3 rate cuts by year-end 2025. The 10-year yield falls to 3.50%. Strategy: Increase duration slightly; favor high-quality corporate bonds and long-term munis to capture capital appreciation.
- Hard Landing (Recession – 25% Probability): Sharp economic contraction; inflation drops rapidly. The Fed cuts rates aggressively. The 10-year yield plummets to 3.00%. Strategy: Aggressively extend duration; overweight long-term Treasuries and agency MBS; reduce credit exposure immediately.
- No Landing (Persistent Inflation – 15% Probability): Economic growth remains strong; inflation sticks above 3.5%; the Fed may hike rates further. The 10-year yield rises to 4.50%. Strategy: Minimize duration (keep it under 3 years); overweight floating-rate notes and short-term Treasuries; avoid fixed-rate long bonds.
Given the base case probability, the prevailing strategy involves a gradual shift from maximum short-duration defensiveness toward a moderate extension of duration, capitalizing on the high current yield while preparing for capital appreciation if rate cuts materialize. Maintaining an average duration between 4.0 and 4.5 years balances current income with potential upside from falling yields.
The technical positioning of the 10-year Treasury yield at 4.02% dictates that investors must adopt a dynamic, rather than static, approach to fixed income allocation. The focus must be on maintaining robust liquidity and high credit quality, positioning the portfolio to pivot quickly in response to definitive shifts in Fed policy or economic data releases.
The global fixed income perspective and currency risk
While the 10-year U.S. Treasury yield at 4.02% dominates domestic fixed income decisions, global diversification offers opportunities and introduces currency risk. Comparative yields in developed markets, such as the German 10-year Bund (currently yielding around 2.5%) and the Japanese Government Bond (JGB) 10-year (near 0.8%), highlight the premium offered by U.S. debt.
This yield differential makes U.S. fixed income highly attractive to international investors, which in turn helps support the 4.02% level and strengthens the U.S. dollar. However, for U.S.-based investors considering international fixed income, the primary consideration is currency hedging. Unhedged exposure to, say, European government bonds means that even if the bond appreciates, a weaker Euro relative to the U.S. dollar can wipe out fixed income gains.
International diversification considerations
Diversification into emerging market (EM) debt, both sovereign and corporate, offers significantly higher yields—often 6% to 9%—but carries elevated credit and volatility risk. EM debt is highly sensitive to U.S. monetary policy; a higher-for-longer Fed stance, supported by the 4.02% 10-year Treasury yield, can increase the cost of dollar-denominated borrowing for EM issuers, leading to potential distress.
For investors seeking global exposure, the recommendation is generally to focus on developed market sovereign bonds that are fully currency-hedged back to the U.S. dollar, effectively allowing the investor to capture any potential capital appreciation from falling global rates without taking on unwanted FX volatility. Unhedged EM exposure should be limited to the riskiest allocation buckets, due to the inherent volatility.
- Developed Market Hedging: Use forward contracts or currency ETFs to neutralize foreign exchange risk when investing in lower-yielding developed market bonds.
- EM Debt Selection: Focus on EM issuers with strong commodity export revenues or those denominated in local currency where the central bank has credible inflation management policies.
- Global Benchmark: The 4.02% U.S. 10-year yield acts as a gravitational center, pulling global capital toward the U.S. and limiting the appeal of comparable foreign fixed income assets unless a substantial currency depreciation is expected.
Ultimately, while global fixed income offers diversification, the current high relative yield of the U.S. 10-year Treasury at 4.02% makes domestic fixed income the most compelling starting point for the majority of U.S. investors planning their 2025 allocations.
| Key Fixed Income Metric | 2025 Allocation Implication |
|---|---|
| 10-Year Treasury Yield (4.02%) | Establishes a high risk-free rate floor; favors high-quality credit over long-duration Treasuries initially. |
| Implied Breakeven Inflation (2.22%) | Allocations to TIPS are favorable if expected inflation exceeds 2.22%; otherwise, nominal Treasuries offer better value. |
| Investment-Grade Spreads (120 bps) | Corporate debt offers attractive yield pickup (approx. 5.22% total yield) but requires vigilance for potential spread widening if a recession hits. |
| Duration Strategy | Maintain moderate duration (3-4 years) with a readiness to extend duration quickly upon confirmation of Fed rate cut cycle. |
Frequently Asked Questions about Fixed Income Allocation
The 4.02% yield makes short-term bond funds, particularly those with durations under two years, highly competitive. They offer attractive current income, often exceeding long-term nominal yields due to the inverted curve, while minimizing capital loss risk if rates rise further, making them ideal for capital preservation.
For large investors, individual bonds allow precise control over duration and maturity, enabling effective laddering. For most investors, diversified bond ETFs (Exchange-Traded Funds) offer liquidity and immediate diversification across credit quality and duration, simplifying the management of interest rate fluctuations around the 4.02% benchmark.
The primary risk of extending duration is that the Federal Reserve might delay rate cuts or even hike further if inflation proves persistent. This would push yields above 4.02%, causing immediate and substantial capital losses on longer-dated bonds, as their price sensitivity to rate changes is significantly higher.
Taxable investors should calculate the tax-equivalent yield (TEY) of munis versus the 4.02% Treasury yield. If the TEY is significantly higher, prioritize high-quality (AA/AAA rated) municipal bonds, focusing on essential service revenue bonds or general obligation issues to maximize after-tax returns while minimizing credit risk.
With the 10-year yield at 4.02% and short-term rates even higher, cash reserves held in money market funds or short-term Treasuries are generating the highest yields in over a decade. This is an opportune time to deploy capital into fixed income, prioritizing short-term instruments to maintain flexibility for eventual duration extension when the Fed cut cycle begins.
The Bottom Line
The stabilization of the 10-year Treasury yield at 4.02% provides a definitive, high-water mark for risk-free returns, fundamentally altering the calculus for fixed income allocation in 2025. This environment demands that investors adopt a nuanced, barbell approach: maintaining substantial exposure to short-duration, high-quality assets to capture current income while retaining the flexibility to extend duration strategically when the economic data clearly signals the Federal Reserve’s pivot toward rate cuts. The risk of being too early in extending duration, resulting in capital losses if yields rise above 4.02%, outweighs the benefit of marginally higher nominal yields. The most successful fixed income portfolios in the coming year will be those that prioritize credit quality and liquidity, using the 4.02% Treasury yield as a baseline for measuring risk-adjusted returns across corporate, municipal, and structured product segments. Vigilance regarding inflation data and the labor market remains paramount, as these indicators will ultimately dictate whether 4.02% proves to be a temporary ceiling or a new, persistent floor for long-term borrowing costs.